Open-source agent evaluation and observability tools help enterprises test AI workflows, inspect their execution, and investigate failures. A useful implementation connects the agent’s answer to its tool calls, the evidence it used, and the result recorded in the business system. That connection lets a team decide whether a change improved the service and whether an incident has actually been fixed.
For business leaders, the central question is practical: can we explain an agent’s failure, verify the outcome, and prevent the same failure from returning?
This guide compares the roles of Langfuse, MLflow, Opik, Promptfoo, and DeepEval, with Phoenix considered separately because of its server license. It also explains what to instrument, what to evaluate, and how to control operating costs. Product and license details were checked against primary sources on 9 October 2026; the recommendations reflect documented capabilities rather than a hands-on performance benchmark.
What agent evaluations and observability mean
An evaluation, often shortened to “eval,” tests behavior against explicit criteria. For a service agent, those criteria might include selecting the correct customer account, using the current policy, and creating the requested case without an unintended duplicate.
Observability provides evidence for understanding execution. A trace connects a request to its individual operations, called spans. For an agent, these can include retrieval, model calls, tool execution, and application logic. Metrics summarize performance across requests; logs add individual events. OpenTelemetry documents how traces and spans represent work across a distributed system.
 The two disciplines meet when a failed evaluation links to the relevant trace, and a production incident becomes a new evaluation case. Runtime authorization remains a separate application responsibility: collecting a trace or scoring it afterward does not itself prevent a prohibited action.
Select tools by the work your team needs to perform. An integrated platform can cover several layers, while a test runner can supplement an existing observability system.
|
|
Useful role in the stack
|
License and deployment boundary
|
| Langfuse |
Shared traces, prompt management, datasets, experiments, and evaluation workflows |
MIT core; separately licensed enterprise features. Self-hosting is available. |
| MLflow |
Agent tracing and evaluation alongside an existing experimentation and model lifecycle workflow |
Apache 2.0 project. Self-hosted OSS and managed Databricks capabilities must be distinguished. |
| Opik |
Integrated tracing, experiments, automated scoring, and online evaluation |
Apache 2.0 platform. Self-hosted deployment has a user-management limitation. |
| Promptfoo |
Configuration-driven comparisons, regression tests, and trace-aware assertions in CI |
MIT core. Enterprise deployments and cloud-backed services are separate offerings. |
| DeepEval |
Python evaluation suites and agent or component metrics |
Apache 2.0 framework. Its documented production metric-collection workflow depends on Confident AI. |
The license classifications come from the projects’ own files: Langfuse, MLflow, Opik, Promptfoo, and DeepEval.
Langfuse for a shared evaluation workspace
Langfuse combines observability with prompt and evaluation workflows. It is a sensible candidate when several people need to inspect the same traces, compare experiments, and review feedback. Langfuse documentation
Check the precise edition you plan to deploy. Current self-hosting documentation lists project-level role-based access control, audit logs, retention policies, and server-side masking among enterprise features. Application-side masking has its own documented implementation. “Self-hosted” therefore does not mean every governance feature is included in the community edition. Langfuse enterprise feature boundary
MLflow provides evaluation datasets, scorers, human feedback, and tracing. Its current production guide also covers automatic online quality evaluation. Teams already operating MLflow should assess these capabilities before introducing another platform. MLflow evaluation · MLflow production tracing
Verify the backend and version used in a demonstration. Databricks documents distinctions between managed features and the open-source project; a capability shown in a managed workspace should not be assumed to exist identically in a self-hosted installation. Databricks observability FAQ
Opik for integrated tracing and online scoring
Opik brings together traces, datasets, experiments, code-based metrics, model graders, and online evaluation. Its official self-hosting guide distinguishes a local setup for getting started from Kubernetes deployment for production, and notes that self-hosting excludes integrated user management. Include that boundary in the access-control design. Opik capabilities · Opik self-hosting
Promptfoo and DeepEval for engineering test suites
Promptfoo supports trace-aware evaluation through an OpenTelemetry Protocol receiver and assertions about execution. DeepEval supports local agent and component evaluations in Python; its documented production metric_collection workflow requires Confident AI. Both are candidates for repeatable tests, but their presence alone does not establish a complete production monitoring service. Promptfoo tracing · DeepEval agent tracing
Where Phoenix fits
Phoenix offers tracing and evaluation and can be self-hosted. However, its server uses Elastic License 2.0, with restrictions on offering substantial functionality as a hosted or managed service to third parties. Treat it as a source-available alternative, rather than grouping its server license with MIT or Apache 2.0. Its Apache-licensed Python client illustrates why the license of an SDK cannot establish the license of the platform. Phoenix project · Server license · Python client license
How to connect traces to business outcomes
Begin with one workflow and retain enough information to reconstruct what happened. The engineering team should record an application release, model identifier, prompt version, relevant source or policy version, tool result, and outcome identifier. Use pseudonymous identifiers where possible instead of copying customer records into telemetry.
Connect activity across services. If an agent hands work to a queue or another service, the instrumentation must preserve the relationship; otherwise, the visible trace may stop before the actual business operation. OpenTelemetry’s context propagation explains the mechanism for linking execution across boundaries. Context propagation
OpenTelemetry can reduce integration dependence on a single backend, but identical transport does not guarantee identical interpretation. The current GenAI span conventions carry Development status. Pin instrumentation versions, record which conventions are used, and verify that nested operations, errors, and usage fields arrive correctly in the chosen tool. Current GenAI span conventions
Add a business outcome check outside the agent’s own completion message. A tool response can be incomplete or misleading, and a later operation can fail. Record whether the case exists, which account owns it, and whether it reached the intended state. Keep that evidence linked to the trace without unnecessarily duplicating sensitive payloads.
Traces record observable activity. They do not reveal the model’s complete internal reasoning or automatically explain causation.
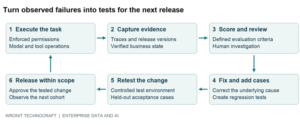 A recommended feedback loop links observable execution and verified outcomes to tests for the next release. Online evaluation runs alongside execution; preventive controls belong in the application.
A worked example from customer support automation
Consider a hypothetical B2B support agent handling a damaged-device report. It may verify the customer, inspect warranty information, and open a replacement request. It cannot authorize a shipment.
The agent tells the customer, “Your replacement request has been created.” An investigation finds the following:
Evidence
|
Observed result
|
Interpretation
|
| Customer lookup |
Correct account returned |
Identity lookup succeeded for this case. |
| Policy retrieval |
Current warranty policy returned |
The relevant policy was available. |
| Create-request tool |
Validation failed because the serial number was missing |
The requested write was not accepted. |
| Authoritative case store |
No replacement request exists |
The completion message is false. |
A tone score could rate the response positively. A state check would fail it. The trace identifies the unhandled validation result, giving engineers a more specific starting point than rewriting the entire prompt.
The correction should make the workflow request the missing serial number or transfer the case with an accurate status. Its regression test should verify that no success claim appears after the failed write, no shipment is authorized, and a valid later submission creates exactly one request. Also test a timeout where the write might have succeeded. Where supported, use a stable idempotency key for the same logical operation and check authoritative status before retrying an ambiguous write. AWS on safe retries
This distinction matters when selecting metrics. For example, DeepEval’s task-completion metric uses a model to interpret the task and trace. That can support review, but a trace-based judgment is not independent confirmation of a record in the business system. DeepEval task completion
Designing evaluations that catch meaningful failures
Use deterministic checks where a property has a definite answer: a record exists, an amount is correct, a prohibited tool was not invoked, or a customer identifier matches the authorized account. Use model graders for judgments such as whether an explanation is supported by evidence or whether a handover is understandable.
Keep human review for rubric development, disputed cases, and consequential decisions. Anthropic’s evaluation guidance distinguishes the execution transcript from the environment’s final state and explains how code, model, and human graders contribute different evidence. Agent evaluation methodology
Avoid requiring one exact tool sequence when several routes are valid. Require essential prerequisites and prohibit unsafe actions. A customer verification step may be mandatory before a write; two independent read operations might reasonably occur in either order.
Keep development examples separate from final acceptance cases. Run important cases repeatedly in reset environments, recording the number of distinct cases and attempts. Repetition reveals variability; adding different cases broadens coverage.
Treat the evaluator as software that also needs validation. Compare its decisions with reviewed examples, record its model and rubric versions, and inspect false passes and false failures. Candidate answers should be treated as untrusted material so that embedded instructions cannot simply tell the judge to award a high score. Promptfoo judge design
An overall score should never hide a critical failure. Report authorization violations, false completion claims, and unintended writes separately from tone or response quality.
Running evaluation in production
Offline evaluations test a defined configuration before release. Online evaluations inspect real activity and help discover situations the original test set missed. Their results need an operating response: a responsible owner, a triage process, and a decision about whether to restrict the affected workflow.
For a support agent, track task acceptance, tool failures, false completion claims, appropriate escalation, response time, and cost. Analyze by application version and relevant segments. A good overall average can conceal poor performance on one document type or, where both are supported, Arabic versus English.
Separate three coverage questions: which requests produced telemetry, which traces were retained, and which retained traces were evaluated. A dashboard showing 99% passing evaluations describes the evaluated population; it does not automatically establish that 99% of all customer requests succeeded.
Combine representative sampling with targeted review of errors and consequential actions. Keep results from deliberately oversampled failures separate, or use an appropriate weighted estimate; otherwise, the reported overall rate can be distorted. Always show the denominator and selection rule.
Monitor the monitoring system too. Export failures, dropped spans, evaluation backlogs, and missing final-state checks can make performance appear better than it is. Preserve essential audit events independently of best-effort diagnostic sampling.
Turn reviewed incidents into regression cases. An unexplained score dip should lead to investigation, not an automatic prompt change deployed to every customer.
Keeping sensitive data out of the wrong systems
Self-hosting determines where selected services run. Model and judge calls may still send data to external endpoints. Promptfoo’s FAQ explicitly distinguishes its local runner from configured providers and cloud-backed features. Map those flows before using production conversations as evaluation data. Promptfoo data-flow FAQ
Start with the smallest useful telemetry payload. OpenTelemetry recommends data minimization and documents attribute removal and redaction mechanisms. Decide who can inspect content, how long it is retained, and which evaluation datasets may contain it. Handling sensitive telemetry
Mask before export when data must stay inside the application boundary. Langfuse distinguishes application-side masking from Collector-side masking, which takes place after telemetry has left the application. Test the actual export with synthetic sensitive values, including error messages and tool responses. Langfuse masking
For an enterprise operating across the US and UAE, document the location of trace storage, backups, evaluator endpoints, and operator access. A deployment diagram should make those choices explicit.
What an open source deployment really costs
Budget for hosting, storage, backups, maintenance, and staff review, as well as model calls. An open-source software license does not remove the cost of running a model-based evaluator.
For an illustrative arithmetic example, suppose an application processes 100,000 requests a month. It selects 10% for evaluation and runs two judge checks on each selected request. That produces 20,000 judge calls, assuming one call per check and no retries. At an assumed average cost of $0.002 per call, the model portion of those checks would be $40. These are invented planning inputs, not a vendor quote, Wronit result, or complete operating budget.
Calculate the wider cost per accepted business task using costs from both successful and unsuccessful attempts. Include human review and recovery effort, and report acceptance and escalation rates alongside the cost. A cheaper model can become more expensive operationally if it causes more failed actions or manual correction.
A practical way to choose and implement the stack
Shortlist an integrated platform based on existing infrastructure: assess MLflow where the team already operates it, and compare Langfuse or Opik where a dedicated workspace would help. Add Promptfoo or DeepEval when its testing workflow meets a specific need the chosen platform does not cover. Avoid deploying multiple overlapping systems without a clear owner for datasets, traces, and scores.
Ask each candidate to demonstrate the same sanitized workflow and failure case. Check whether your team can find the failed operation, verify the final state, export the evidence, and turn it into a test. Then validate access restrictions, retention, backup recovery, ingestion behavior, and operating cost in the edition you intend to run.
Begin with a bounded pilot. Agree on acceptance criteria with the business owner, instrument the workflow, establish a reviewed baseline, and release to a limited scope. Expansion should depend on the evidence collected and the team’s ability to respond to failures.
FAQs
What is the difference between agent evals and observability
Evaluations judge behavior against defined criteria. Observability records and connects execution evidence so teams can investigate behavior. They work together when scores link to traces and verified business outcomes.
There is no universal winner. Langfuse, MLflow, and Opik offer overlapping platform capabilities, with different operational and edition boundaries. Compare them on your workflow, existing infrastructure, and ability to investigate an actual failure.
Can open source evaluation work without paid model APIs
Deterministic checks can run without a judge model. Some model-based checks can use a compatible model hosted within your environment, subject to tool support. Compute, operations, and reviewer time still have costs.
Does a high evaluation score prove an agent is reliable
It establishes performance under the tested criteria and conditions. Reliability also depends on case coverage, repeated behavior, runtime controls, missing telemetry, and outcomes observed after deployment.
Discuss an agent evaluation pilot with Wronit
Bring one workflow, representative inputs, and an example of an unacceptable outcome to Wronit Technocraft. Discuss how its generative AI services and data engineering services could support an evaluation pilot, with instrumentation, test cases, acceptance evidence, and operating responsibilities agreed at the outset.
Keep this section outside the public article body. Publish the manuscript as a companion to Article 14 on production readiness: that article covers acceptance decisions, while this one targets tool selection and the operating feedback loop.
#Open Source Agent Evals and Observability#Open Source Agent Evals and Observability for Enterprise AI